Monday, December 8, 2008

Windrose


This windrose is used to show how wind speed and direction are typically distributed in a given location. According to the windrose, a significant amount of the wind energy is coming from West by Northwest.

Climograph


This climograph, plotted in monthly intervals, is a representation of the relationship between the temperature and precipitation in Fairbanks. The red line illustrates the maximum temperature and the blue line shows the minimum temperature. According to climograph, the coldest possible temperature was in January at around -15 degrees (F). The green bars show precipitation.

Scatterplot


Scatterplots are used to show the relationship between two variables. The upward trend of this scatterplot illustrates a positive association between the two variables. A downward trend would have indicated a negative association.


http://www.stat.yale.edu/Courses/1997-98/101/scatter.htm

Index Value Plot


In this map an index value is plotted instead of an absolute number. On this map, the index is based on relative daily closings in given countries (Canada, France, Germany, Japan, UK, US) from 1992-2004. From the map, we can see that in 2000, Germany's relative daily closing were significantly higher than the other countries listed.


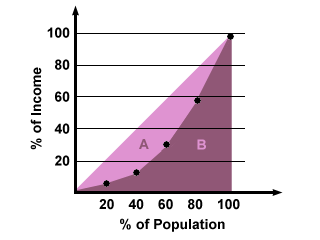
Accumulative Line Graph or Lorenz Curve


The Lorenz Curve is the dotted lined between the light and dark purple shading, and shows income distribution among a specified population. Because the Lorenz Curve slopes downward, we can see that a small percentage of the population earns a disproportionately large income.

Bilateral Graph


A bilateral graph is a visualization graph. On this graph, the two related variables are the demand deposits and the long term deposits. The graph also depicts positive and negative values. The postive values are above the zero line, and negative values below the zero line.
http://www.resbank.co.za/Economics/year96/graph/graph28.jpg

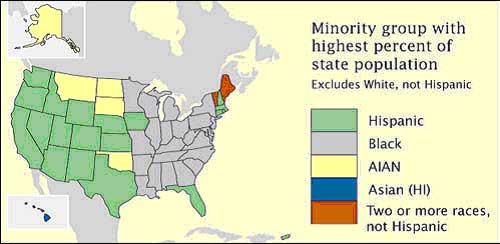
Nominal Area Choropleth Map

This is a nominal area choropleth map showing the percentages of minority groups in each state. The data is nominal because is put into categories that cannot be measured or ordered. However, it is still clearly defined through the use of color.

https://courseware.e-education.psu.edu/courses/geog482/policies.shtml